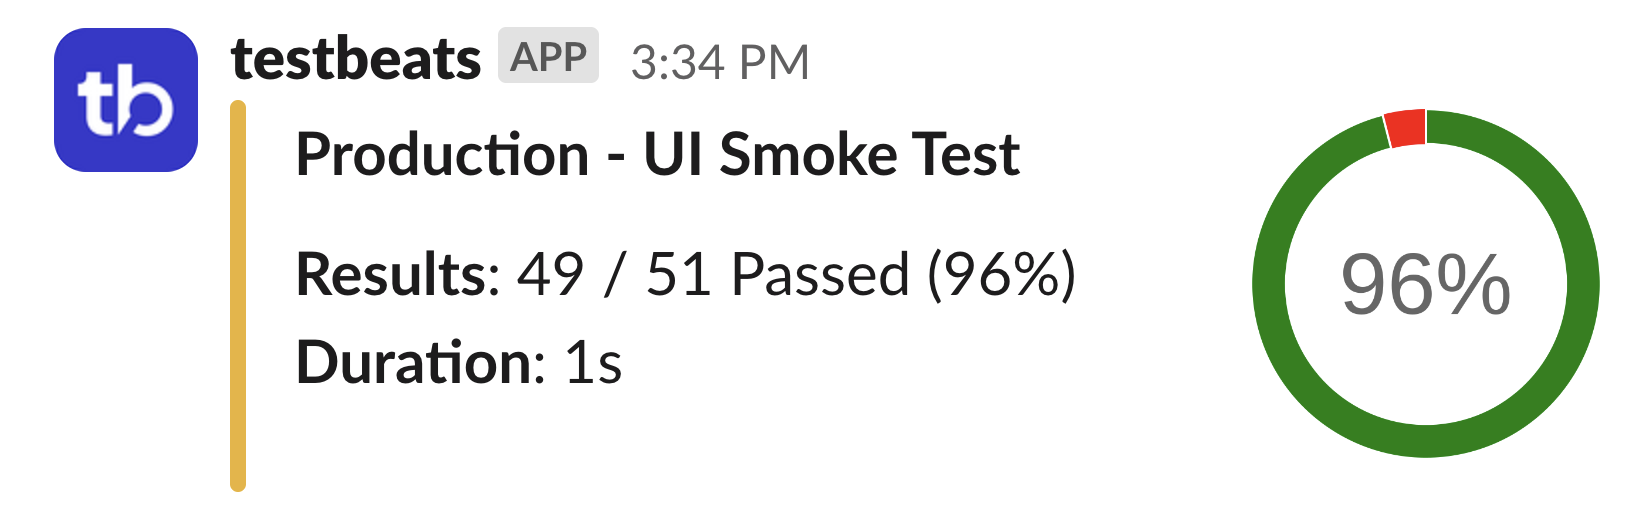
Chart Test Summary Extension ​
This extension attaches a radial gauge representing total pass percentage using QuickChart. It provides a visual representation of your test results that makes it easy to quickly assess the overall health of your test suite.
Limitations
This extension is not supported for Google Chat target.
Configuration ​
Basic Syntax ​
{
"name": "quick-chart-test-summary",
"inputs": {
"url": "<quick-chart-custom-url>"
}
}
Parameters ​
url
(string, optional) - QuickChart custom URL- Defaults to
https://quickchart.io
- Use custom URL for self-hosted QuickChart instances:
https://your-domain.quickchart.com
- Defaults to
Default Behavior ​
- Hook:
after-summary
- Condition:
passOrFail
Examples ​
Default Configuration ​
Use the default QuickChart service:
{
"targets": [
{
"name": "teams",
"inputs": {
"url": "{TEAMS_WEBHOOK_URL}"
},
"extensions": [
{
"name": "quick-chart-test-summary"
}
]
}
]
}
Custom QuickChart URL ​
Use a self-hosted or custom QuickChart instance:
{
"targets": [
{
"name": "slack",
"inputs": {
"url": "{SLACK_WEBHOOK_URL}"
},
"extensions": [
{
"name": "quick-chart-test-summary",
"inputs": {
"url": "https://charts.company.com"
}
}
]
}
]
}
Multi-Target Configuration ​
Add charts to multiple notification targets:
{
"targets": [
{
"name": "slack",
"inputs": {
"url": "{SLACK_WEBHOOK_URL}"
},
"extensions": [
{
"name": "quick-chart-test-summary"
}
]
},
{
"name": "teams",
"inputs": {
"url": "{TEAMS_WEBHOOK_URL}"
},
"extensions": [
{
"name": "quick-chart-test-summary"
}
]
}
]
}
Conditional Chart Display ​
Show charts only when specific conditions are met:
{
"name": "quick-chart-test-summary",
"condition": "result.total > 10",
"inputs": {
"url": "https://charts.company.com"
}
}
Platform-Specific Output ​
Slack ​
- Chart appears as an embedded image
- Displays alongside other test summary information
- Maintains consistent styling with other Slack elements
Microsoft Teams ​
- Chart appears as a card attachment
- Integrates with Teams' card-based layout
- Provides clear visual summary of test results
Chart Details ​
Visual Elements ​
The radial gauge chart includes:
- Pass Percentage: Large central number showing overall pass rate
- Color Coding:
- Green: High pass rates (typically 80%+)
- Yellow/Orange: Medium pass rates (50-80%)
- Red: Low pass rates (below 50%)
- Progress Ring: Visual representation of the pass percentage
- Test Counts: Additional context showing passed/total tests
Chart Generation ​
The extension automatically:
- Calculates pass percentage from test results
- Generates QuickChart URL with appropriate parameters
- Embeds the chart in the notification
- Handles errors gracefully if chart generation fails
QuickChart Integration ​
About QuickChart ​
QuickChart is a service that generates charts from URLs. It supports:
- Various chart types (bar, line, pie, gauge, etc.)
- Customizable colors and styling
- High-resolution output
- Self-hosted options for enterprise use
Self-Hosted QuickChart ​
For enterprise environments, you can deploy your own QuickChart instance:
# Docker deployment
docker run -p 3400:3400 ianw/quickchart
# Then use in configuration
{
"name": "quick-chart-test-summary",
"inputs": {
"url": "http://localhost:3400"
}
}
Custom Chart Parameters ​
While the extension uses predefined chart parameters optimized for test summaries, you can explore QuickChart's documentation for advanced customization options if you need to create custom chart extensions.
Best Practices ​
When to Use Charts ​
- Large test suites where visual summaries are helpful
- Executive reporting where visual impact is important
- Team dashboards where quick assessment is needed
- Trend monitoring when combined with historical data
Performance Considerations ​
- Chart generation adds a small delay to notifications
- Network dependency on QuickChart service availability
- Image size may affect notification loading times
- Rate limits may apply to QuickChart usage
Related Documentation ​
- Extensions Overview - Complete extensions reference
- Configuration Guide - General configuration help
- QuickChart Documentation - Chart customization options